👀 🎲 📰
Answer: Yes, but only somewhat well.
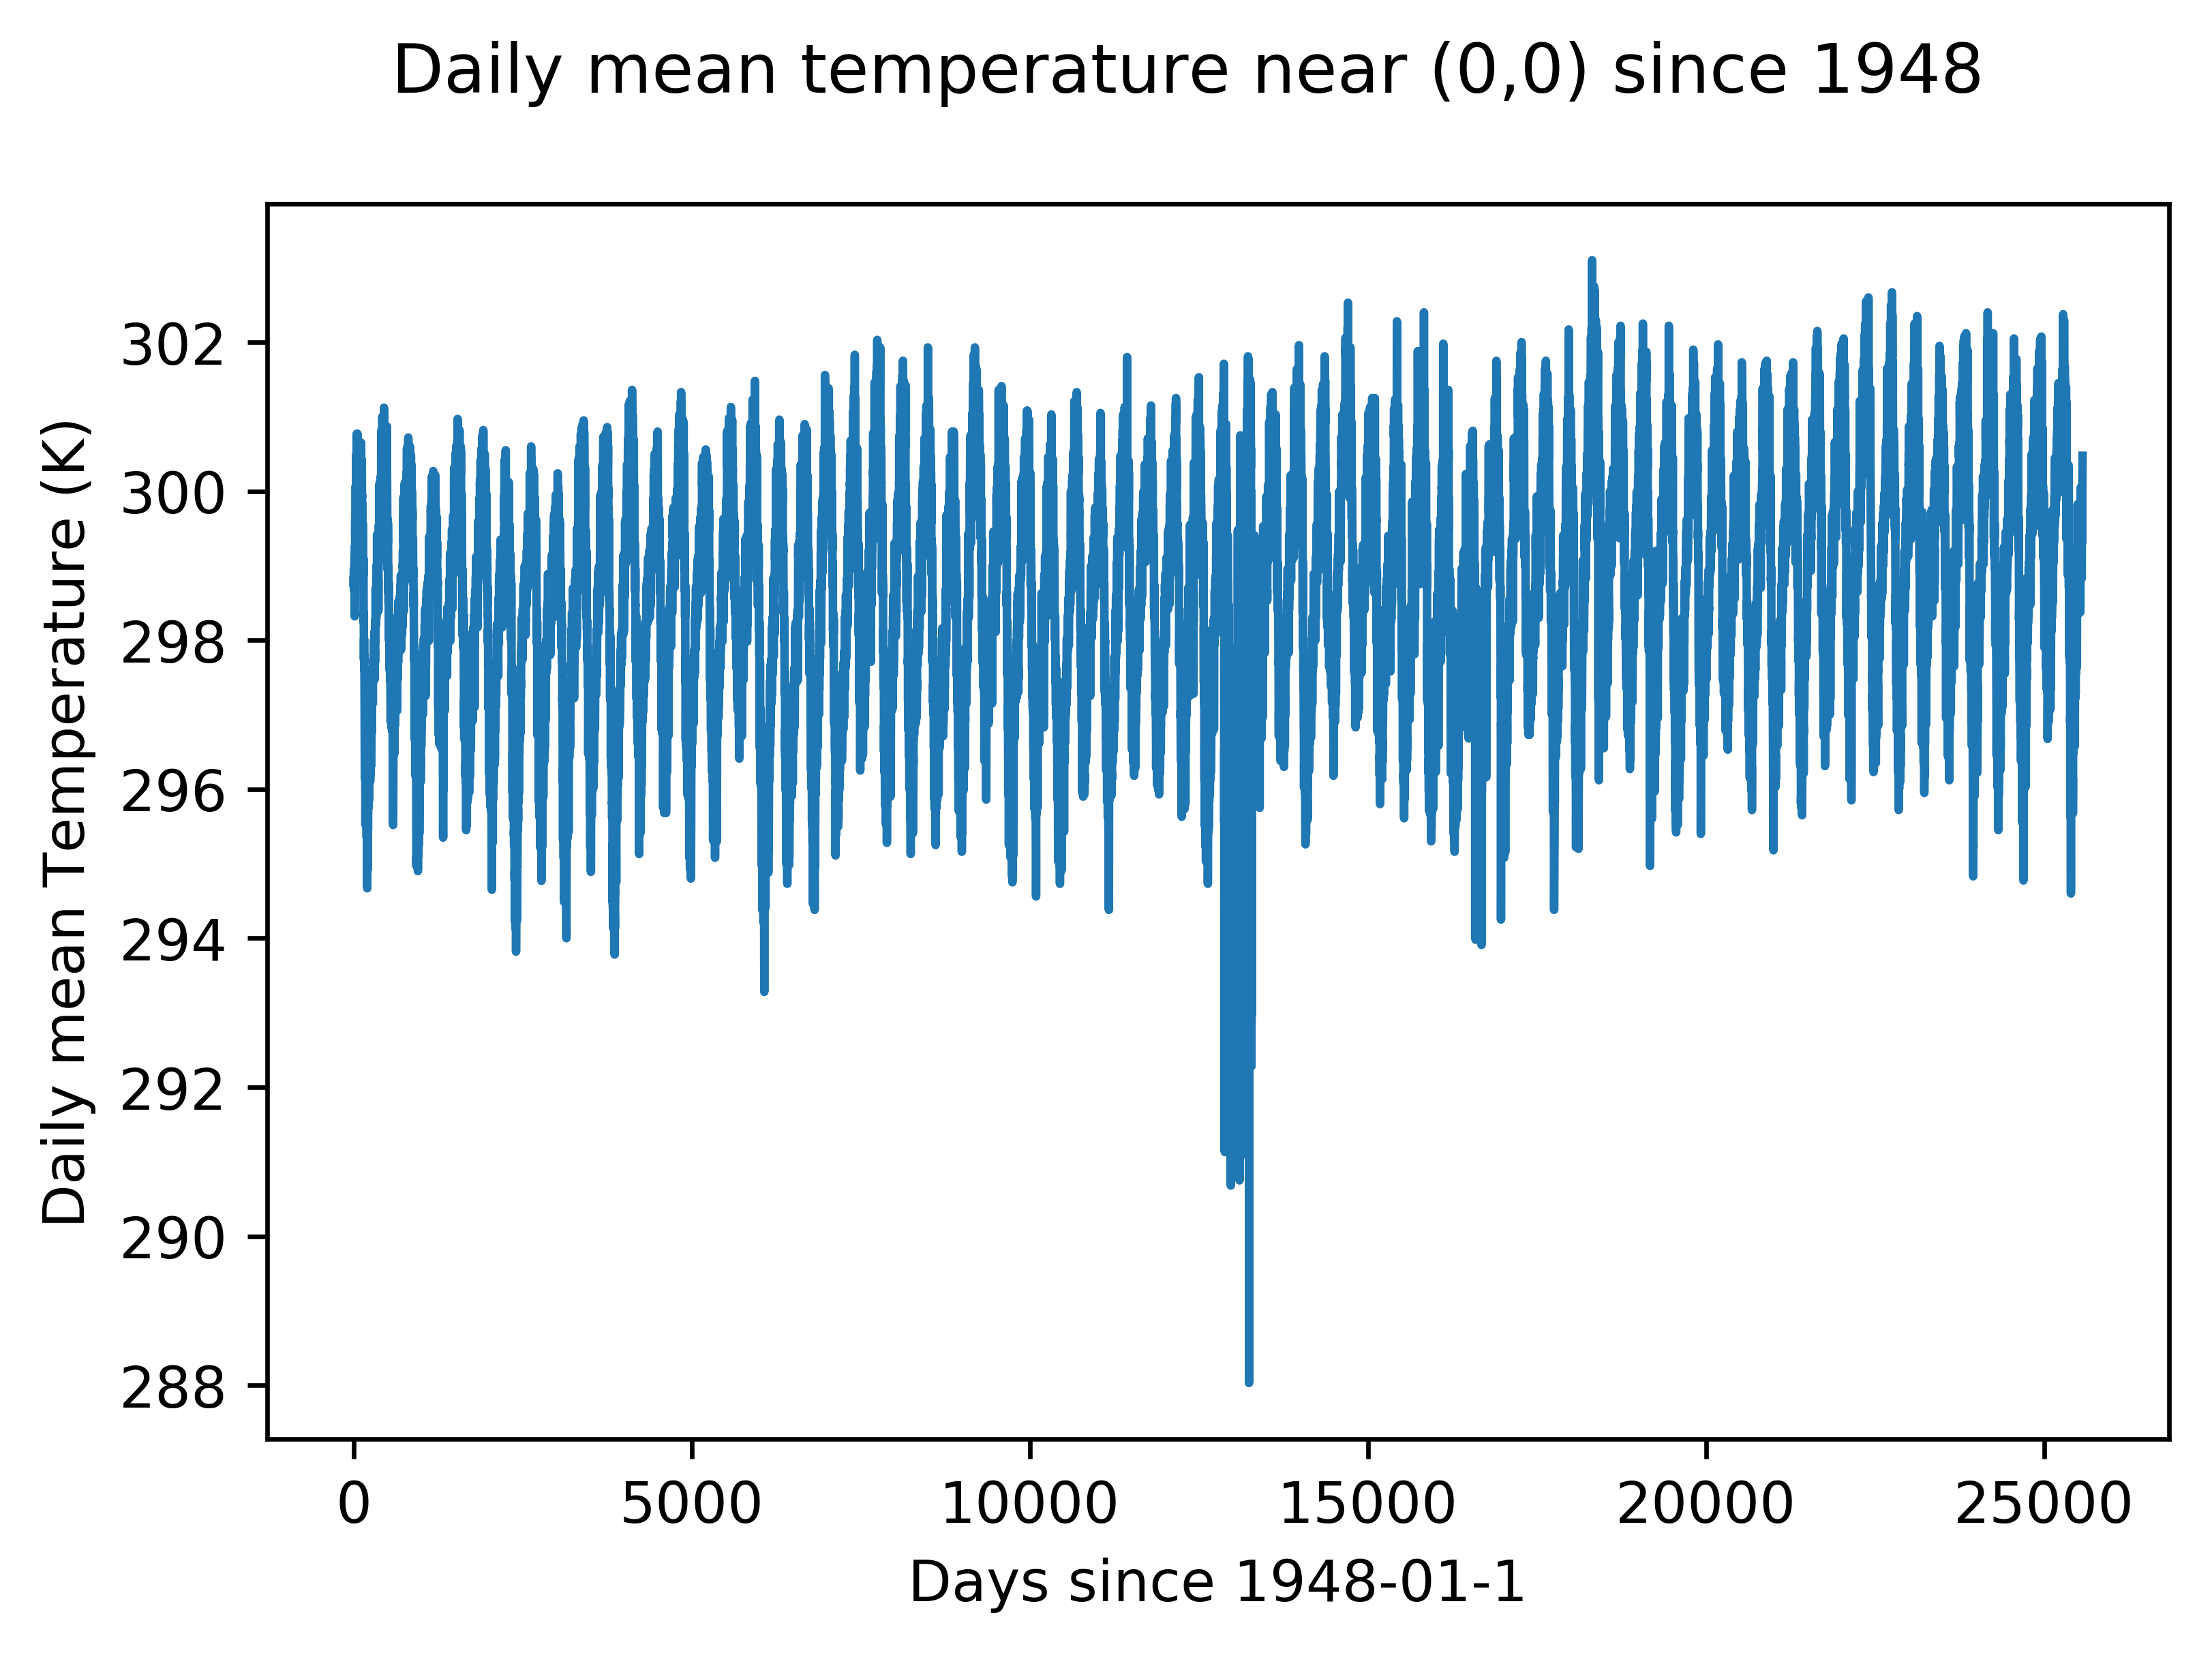
I used decades of data from NOAA to add the temperature variable to my model. Here is a demonstration of that data at an arbitrary point. An upwards trend in temperature is apparent.
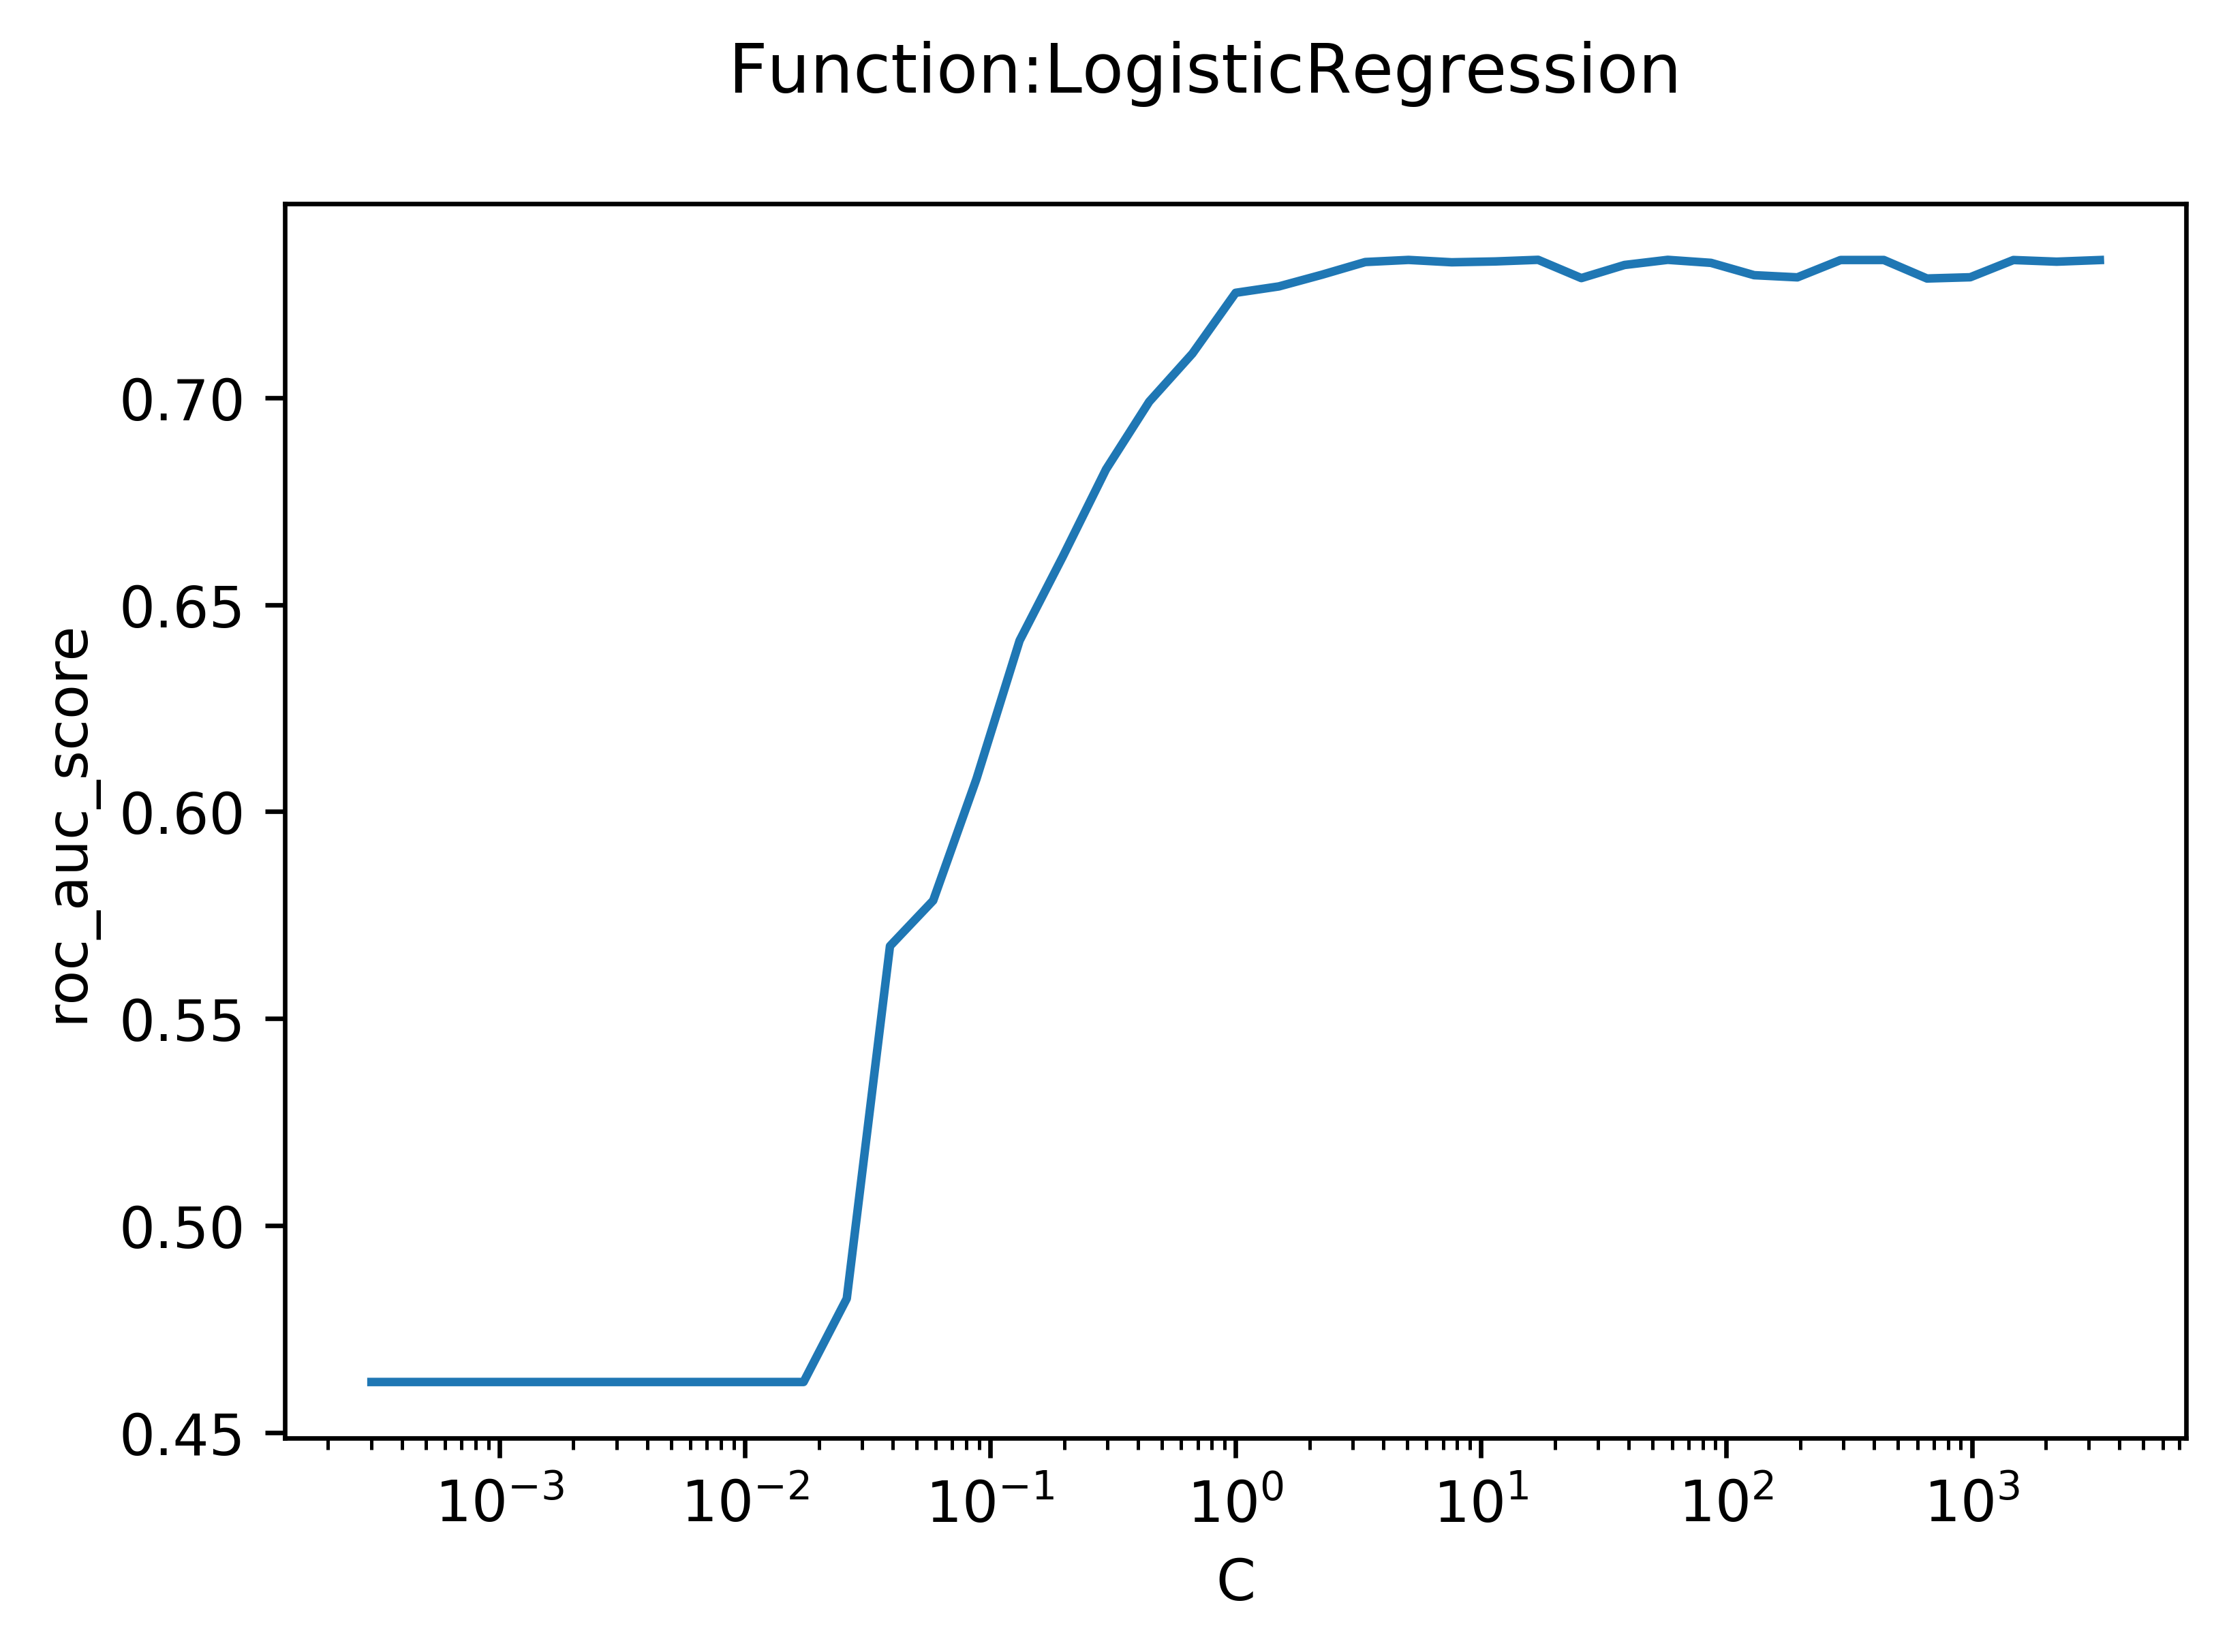
I used a logistic regression model to predict whether a rocket launch would succeed ("1") or fail ("0"). To decrease the coefficiencts on noisy variables, a cost function was added. The plot seen below is the output of a function I wrote that fits an arbitrary model (in this case, Logistic Regression) repeatedly while varying an arbitrary hyperparameter (in this case, C, the weight of the cost function). A low C means that the cost function was weighted very heavily, and a high C represents a very low weight.
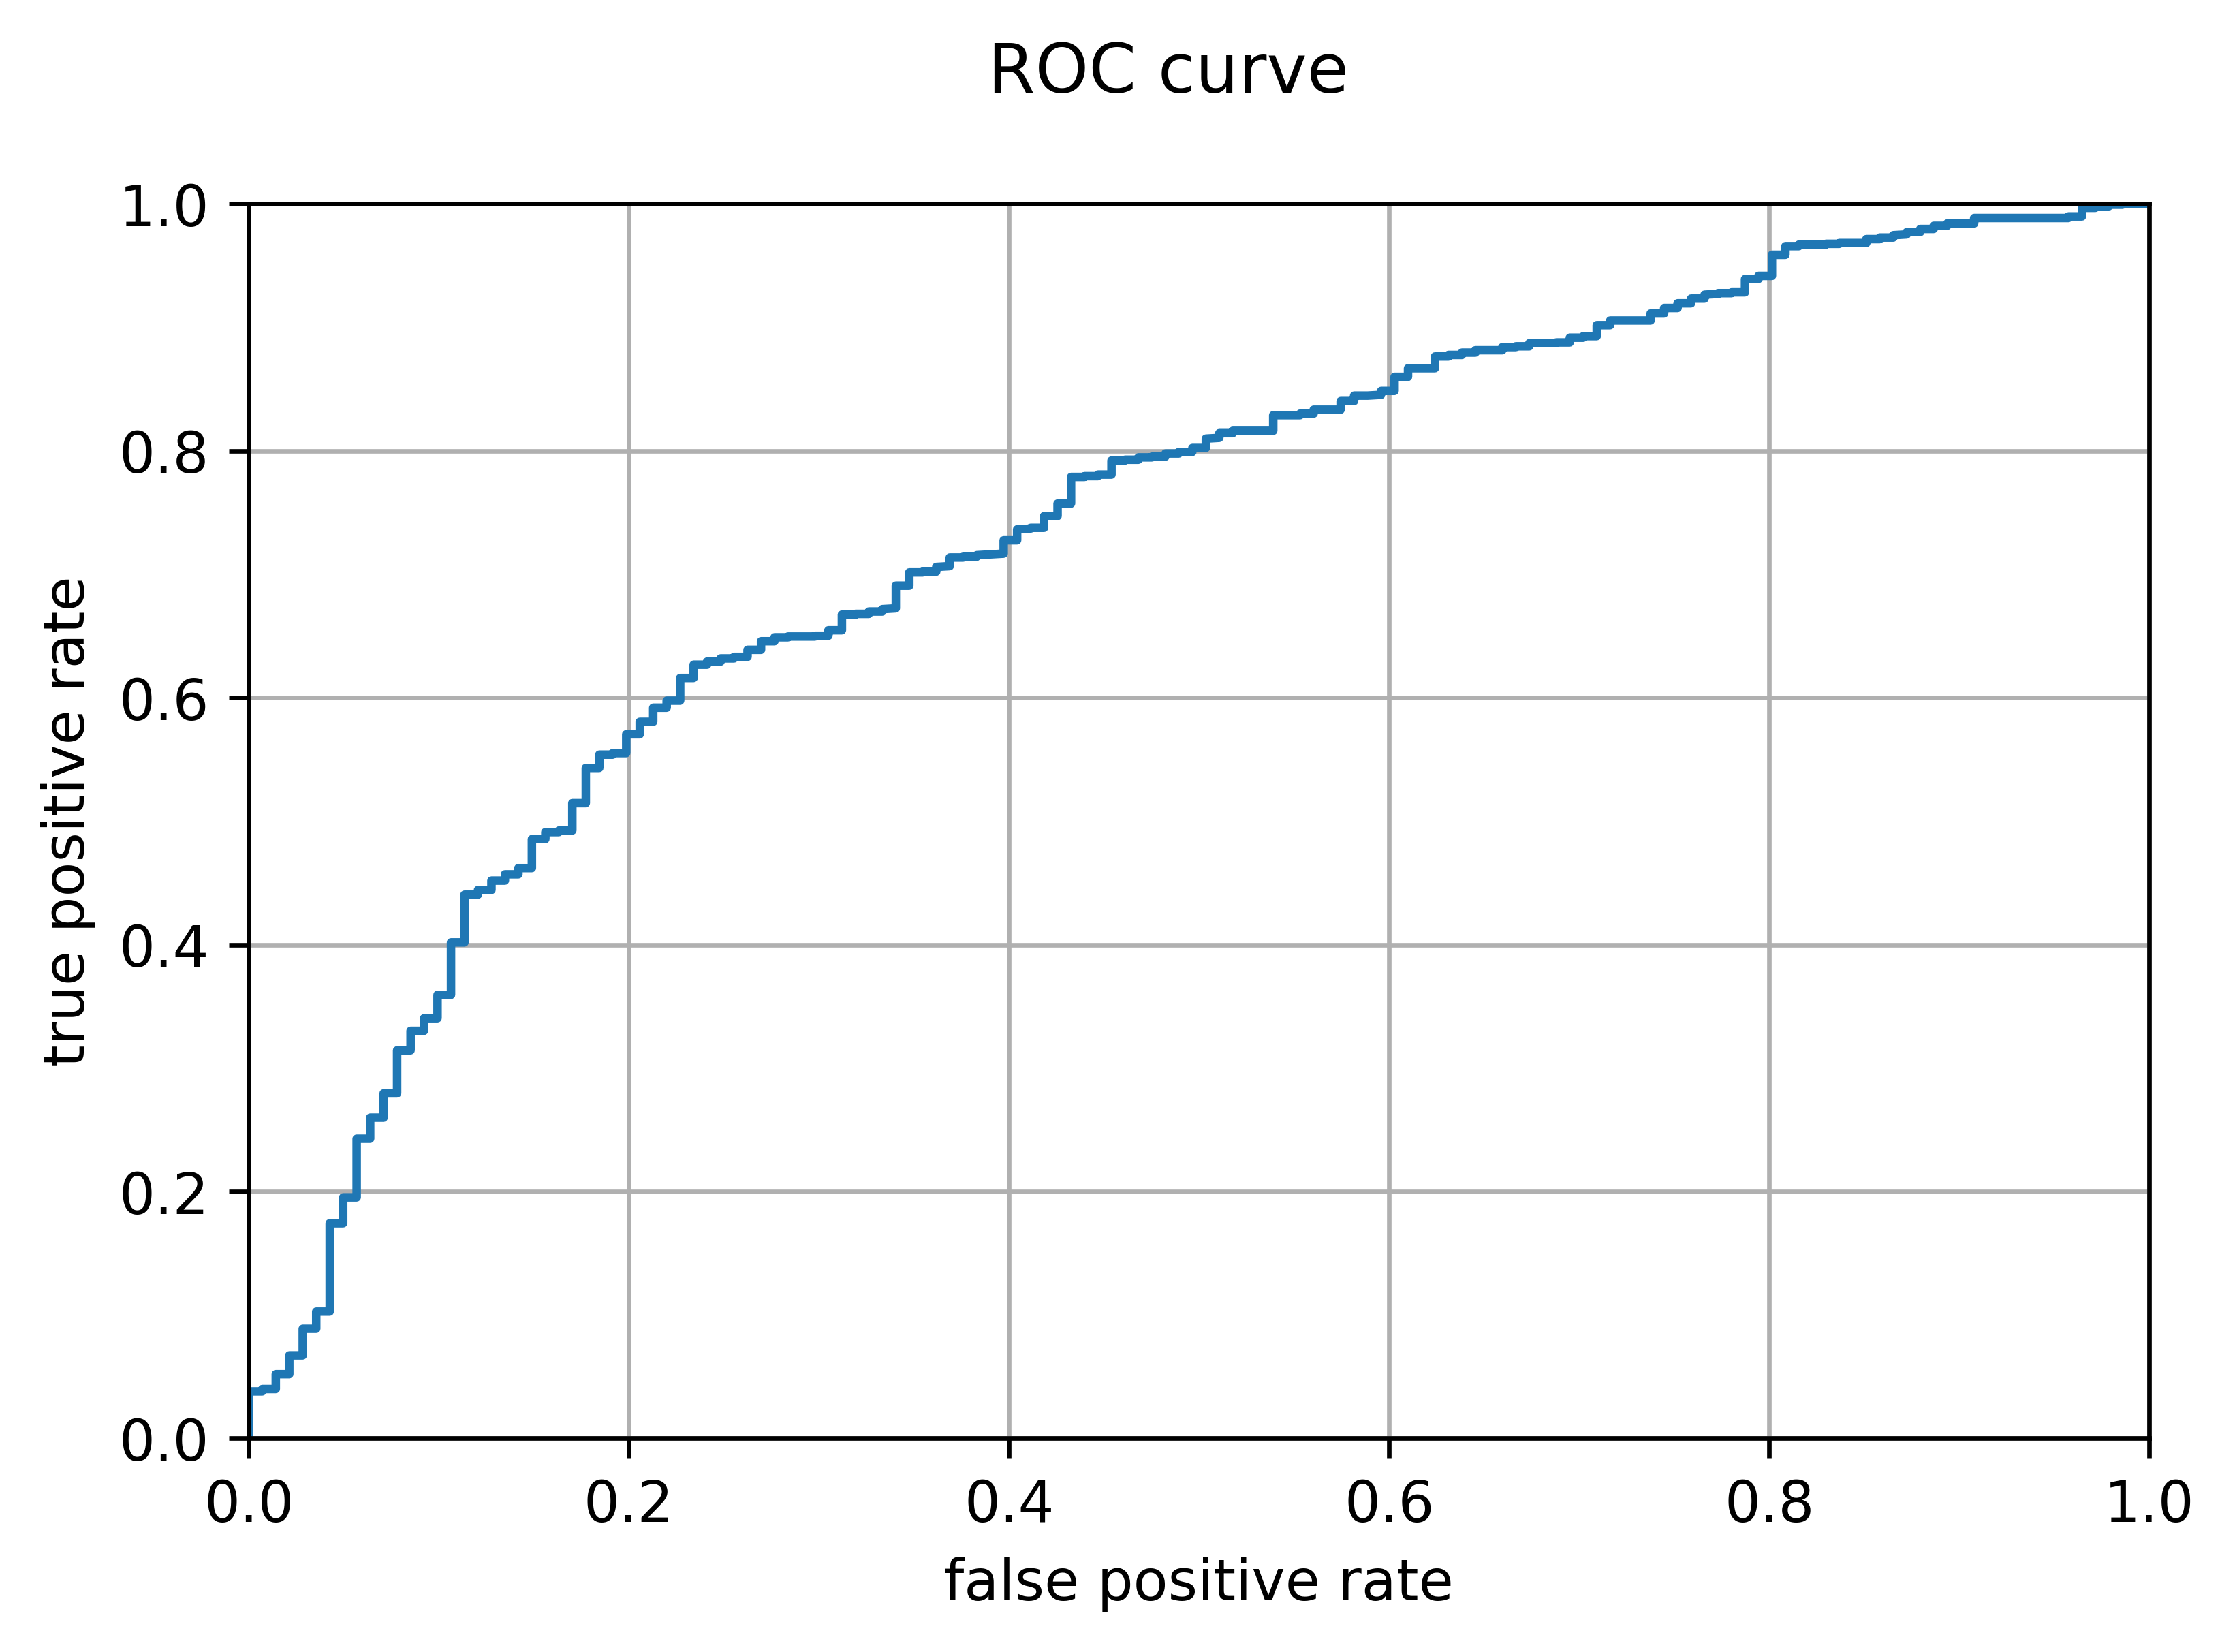
Because different use-cases may necessitate different thresholds for deciding whether a rocket will fail or not, the model must be evaluated for every possible threshold. One method of doing this for a binary classifier is a receiver operating characteristic curve, which plots the true positive rate against the false positive rate as the threshold varies. Ideally, the area under the curve should be maximized (this area was the metric I used to choose a C value in the plot above). The plot below is the output of a function I wrote which generates and plots an ROC curve. It is evident that the model performs better than a coin toss (whose ROC curve would simply be a line x=y), but the area under the curve is not very large, at just 0.733.
Here is the code I used for this research. It's not particularly high-quality or well-documented. It is intended to be run block-by-block in an IPython notebook.
from datetime import date, timedelta

import sys
sys.path.insert(0, '/home/aozerov/Dropbox/programming/jupyter')

from netCDF4 import Dataset
from ftplib import FTP

from sklearn.linear_model import LogisticRegression
from sklearn.ensemble import RandomForestClassifier
from sklearn.neighbors import KNeighborsClassifier
from sklearn.tree import DecisionTreeClassifier
from sklearn.ensemble import GradientBoostingClassifier
from sklearn.svm import SVC
from sklearn.neural_network import MLPClassifier
from sklearn import tree

from sklearn.feature_selection import SelectKBest
from sklearn.feature_selection import SelectPercentile
from sklearn.feature_selection import f_classif
from sklearn.feature_selection import chi2

from sklearn.model_selection import train_test_split

from sklearn.preprocessing import Imputer

from sklearn.metrics import f1_score
from sklearn.metrics import roc_auc_score
from sklearn.metrics import mean_squared_error
from sklearn.metrics import roc_curve
from sklearn.metrics import confusion_matrix

from IPython.display import clear_output
from IPython.display import SVG

#NEED TO FIGURE OUT HOW TO MAKE THIS WORK:
#from graphviz import Source

import pandas as pd
import numpy as np
import matplotlib.pyplot as plt
import os
import pickle
from sqlalchemy import create_engine

import funcs
import sql

#auto import the funcs file
%load_ext autoreload
%autoreload 1
%aimport funcs
%aimport sql

for i in range (1950, 2019):
    ftp = FTP('ftp.cdc.noaa.gov')
    ftp.login()
    ftp.cwd('/Datasets/ncep.reanalysis.dailyavgs/surface')
    file = open("[name-of-directory]/y%s.nc" %i, 'wb')
    ftp.retrbinary('RETR air.sig995.%s.nc' %i, file.write)
    ftp.quit()

#run the resultant code printed by this in unix to concatenate all the new ncr files
command = "ncrcat"
for i in range(1948,2018):
    command += " y"
    command += str(i)
    command += ".nc"
command += " surface_temp.nc"
print(command)

os.environ["HDF5_USE_FILE_LOCKING"] = "FALSE"

surface_temp = Dataset("/home/aozerov/Dropbox/programming/jupyter/mathia/surface_temp.nc", 'r', format='NETCDF4')

lats = surface_temp.variables['lat'][:]
lons = surface_temp.variables['lon'][:]
print(lats)

time = surface_temp.variables['time'][:]
print(time)
print(surface_temp.variables['time'][:])
air = surface_temp.variables['air'][:]


# Find the nearest latitude and longitude for 0,0
location = {'name': '0,0', 'lat': 0, 'lon': 0}
lat_idx = np.abs(lats - location['lat']).argmin()
lon_idx = np.abs(lons - location['lon']).argmin()

#CREDIT TO JONATHAN MCDOWELL FOR HIS LAUNCHLOG.
#launchlog.csv is merely a slightly processed version of his log at:
#https://planet4589.org/space/log/launchlog.txt
launches = pd.read_csv("[path-to]/launchlog.csv")
print(launches.head())
print(launches.shape)

print(launches.columns.values)
launches = launches.rename(columns={'# Launch': 'launchnum'})
launchesp = launches[launches.launchnum.notnull()]
print(launchesp.shape)

coldel = ['launchnum', 'Ref','Launch Date (UTC)', 'COSPAR', 'PL Name', 'Orig PL Name', 'SATCAT', 'LV S/N', 'Unnamed: 9', 'Unnamed: 12', 'Unnamed: 13', 'Unnamed: 14', 'Unnamed: 15', 'Unnamed: 17', 'Unnamed: 18', 'Unnamed: 19', 'Unnamed: 20', 'Unnamed: 21', 'Unnamed: 22']
launchesp = launchesp.drop(columns = coldel)
print(launchesp.columns.values)

launchesp["surfacetemp"] = np.nan

print(time)
timeadjust = []
start = date(1800,1,1)
for i in range (0, len(time)):
    hours = time[i]
    days = hours/24
    delta = timedelta(days)     # Create a time delta object from the number of days
    offset = start + delta
    print(offset)
    timeadjust.append(offset)
    print(delta)

#print temperature graph at 0,0
print(np.arange(731))
print(air[:, lat_idx, lon_idx].size)
#np.column_stack((predictors_intercept, coefs_intercept))
plt.figure(dpi=600)
plt.plot(np.arange(air[:, lat_idx, lon_idx].size), air[:,lat_idx,lon_idx],'-')
plt.suptitle('Daily mean temperature near (0,0) since 1948')
plt.xlabel('Days since 1948-01-1')
plt.ylabel('Daily mean Temperature (K)')
plt.show()

#CREDIT TO JONATHAN MCDOWELL FOR HIS LIST OF SITES.
#sites.csv is merely a slightly processed version of his list at:
#https://planet4589.org/space/lvdb/sdb/Sites
sites = pd.read_csv("[path-to],sites2.csv")
sites.head()

# need to convert dates in launchesp to days*24 since 1948-01-01
launch_surface_temps = []
for i in range (0, launchesp.shape[0]):
    #conver 'LAUNCH DATE' column to date objects
    ldatestr = launchesp.iloc[i]['LAUNCH DATE']
    #ldateobj = datetime.strptime(ldatestr, '%Y-%m-%d').date()
    ldateobj = date(*map(int, ldatestr.split('-')))
    print(ldateobj)
    sourcedate = date(1948,1,1)
    tindex = (ldateobj-sourcedate).days
    print(tindex)

    sitestr = launchesp.iloc[i]['Site']
    print(sitestr)
    for j in range (0, sites.shape[0]):
        if sites.iloc[j]['code'] == sitestr:
            lat = sites.iloc[j]['lat']
            long = sites.iloc[j]['long']
            break
    lat_idx = np.abs(lats - lat).argmin()
    lon_idx = np.abs(lons - long).argmin()
    launch_surface_temp = air[tindex,lat_idx,lon_idx]
    print(launch_surface_temp)
    launch_surface_temps.append(launch_surface_temp)

launchesp['surfacetemp'] = launch_surface_temps
launchesp.head()

launchesp_dummies = pd.get_dummies(launchesp, prefix=['LV Type_','Site_'], columns=['LV Type','Site'])
print(launchesp_dummies.shape)

Suc = launchesp_dummies['Suc']
launchesp_dummies.drop(labels=['Suc'], axis=1,inplace = True)
launchesp_dummies.drop(labels=['LAUNCH DATE'], axis = 1,inplace = True)
launchesp_dummies.insert(428, 'suc', Suc)
launchesp_dummies.head()

df2 = launchesp_dummies
df2 = df2.replace('S', 1)
df2 = df2.replace('F', 0)
df = df2
df['suc'].mean()
df.drop([col for col, val in df.sum().iteritems() if val < 10], axis=1, inplace=True)
#for column in df2:
 #   tot = df2.ix[0,].sum
  #  print(tot)
   # if tot < 10:
    #    df.drop(labels=[column], axis=1,inplace = True)
df.head()


#create numpy arrays of the pandas dataframes
npdata = df.values

length = npdata.shape[1] #get number of columns
print(length)

#put all columns including and up to the last predictor into a numpy array
x = npdata[:,:(length-1)]
print(x)

#put last column (the response variable) into a numpy array
y = npdata[:,(length-1)]

#add the 3rd column squared as a predictor into column 3 (0-indexed)
x = np.insert(x,3,np.power(x[:,3],2),1)

indices = df.columns #get column titles in the form of an array
indices = np.insert(indices,3,'col14^2') #insert header for the new column 14 to maintain consistency with data
print(indices)

x_train, x_test, y_train, y_test = train_test_split(x, y, test_size=0.3, random_state = 42)

#test with n predictors from 1 to 40
varresults = preds.optimize_var(1,130,indices) #save results to an array
preds.grf() #graph results

x_traint, x_testt, predictors = funcs.transform(x_train, y_train, x_test, indices, 60)

preds = funcs.UniversalOptimizer()
preds.function = "LogisticRegression"
preds.set_data(x_traint,y_train,x_testt,y_test)
preds.func_init()
preds.model.penalty = 'l1' #penalty needs to be l1 when solver is liblinear. Kernel dies otherwise
preds.scorefunc = 'roc_auc_score'
preds.set_varscorer('f_classif')
print(preds.model.get_params)

#optimize logisitc regression from a C value of 10^-4 to a C value of 10^4
preds.optimize_func(-20,20,1.5,True,'C')
preds.grf()
print(preds.model.coef_.ravel())

#Create and fit a logistic regression model
logreg = LogisticRegression(penalty = 'l1', C = 100, solver = 'liblinear', random_state = 1, n_jobs = 1)
logreg.fit(x_traint, y_train)

#create numpy arrays of predicted probabilities
trainpred_logreg = logreg.predict_proba(x_traint) #predict training probabilities
trainpred_logreg = np.delete(trainpred_logreg,0,axis=1) #remove column of probability of belonging to class 0

testpred_logreg = logreg.predict_proba(x_testt) #predict testing probabilities
testpred_logreg = np.delete(testpred_logreg,0,axis=1) #remove column of probability of belonging to class 0

print('train area under roc curve:', roc_auc_score(y_train,trainpred_logreg))
print('test area under roc curve:', roc_auc_score(y_test,testpred_logreg))

funcs.plot_roc(y_test, testpred_logreg)

coefs = logreg.coef_.ravel()
predictors_intercept = np.insert(predictors, 0, 'intercept')
coefs_intercept = np.insert(coefs,0,logreg.intercept_)
predcoefs = np.column_stack((predictors_intercept, coefs_intercept))
print(predcoefs)

np.savetxt("[path-to]/ytrain.csv", y_train, delimiter = ',', fmt = ('%s'))